☀️
NovaSolar
AI
Home
How It Works
Solar Analysis
Incentives
Installers
Pricing
Blog
Support
🌐
EN
English
Deutsch
Nederlands
Français
Azərbaycanca
Sign In
Analyze My Home →
Home
How It Works
Solar Analysis
Incentives
Installers
Support
🌐
EN
English
Deutsch
Nederlands
Français
Azərbaycanca
Sign In
Analyze My Home →
🏠
Home
›
Solar Analysis
›
Results
Your
Solar Potential
123 Maple Street, Berlin · Analyzed September 2026
Solar Score
92
/100
Excellent Potential
⚡
8,420 kWh
Annual production
↑ 12%
vs. regional average
€
€1,740
Annual savings
7.1 years payback
☀️
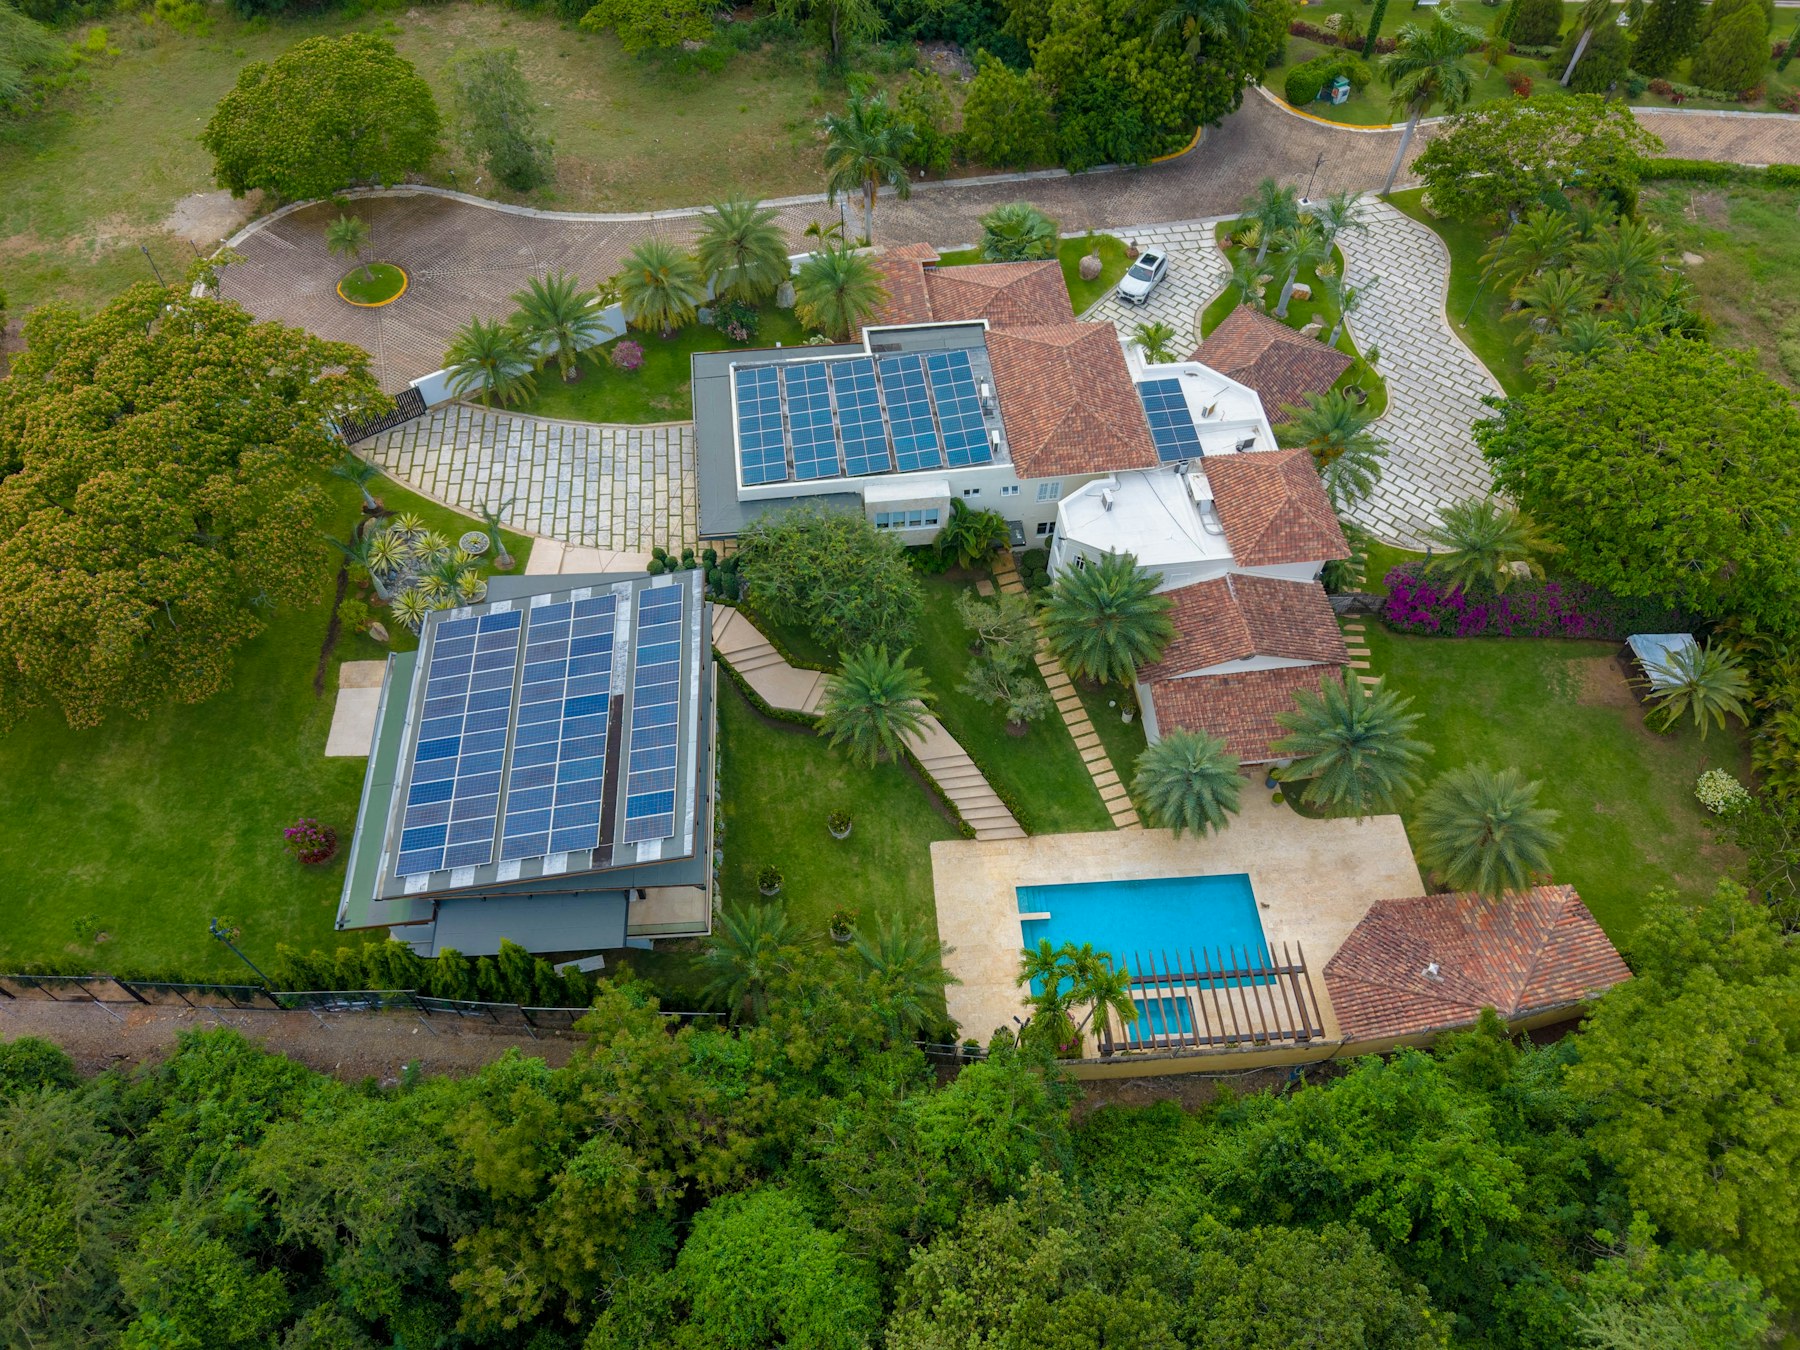
7.2 kWp
Recommended system size
22 panels
🌍
3.2 t
CO₂ saved / year
≈ 160 trees planted
Energy Production Forecast
Monthly
Yearly
Table
Jan
Feb
Mar
Apr
May
Jun
Jul
Aug
Sep
Oct
Nov
Dec
Y1
Y2
Y3
Y4
Y5
Y10
Y15
Y20
Y25
Month
Production (kWh)
Jan
320
Feb
405
Mar
540
Apr
675
May
790
Jun
845
Jul
825
Aug
760
Sep
590
Oct
440
Nov
305
Dec
255
Electricity Usage Coverage
70%
self-covered
Self-consumed solar power
70%
Grid electricity
30%
Savings Calculator
Annual electricity usage
4,200 kWh
Electricity price
€0.38 / kWh
System size
7.2 kWp
€1,740
Estimated yearly savings
7.1
yrs
Estimated payback period
Your Environmental Impact
3.2 t
CO₂ saved per year
≈160
Trees planted equivalent
8,420 kWh
Clean energy produced
Your Solar Home Report
📄 Download PDF Report
Next Steps
1
Compare installer quotes
Get 3-5 quotes from verified local installers.
2
Check available incentives
See which subsidies and financing options apply to you.
3
Schedule an installation
Choose your installer and lock in your installation date.
Find Installers →